Image Details
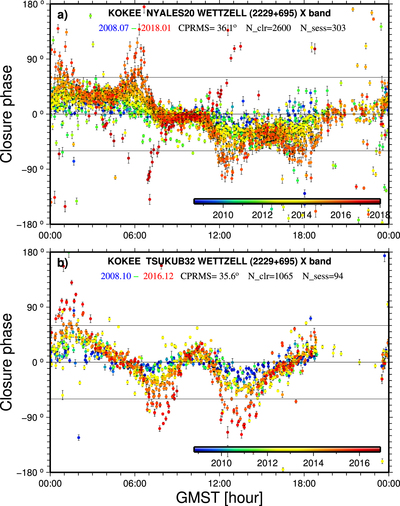
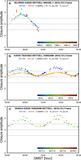
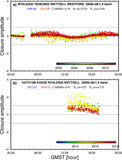
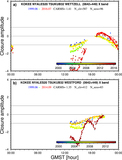
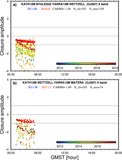
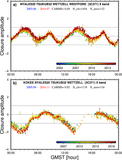
Caption: Figure 4.
Plots of closure phases at the X band for source 2229+695 as a function of GMST for two triangles, (a) KOKEE–NYALES20–WETTZELL and (b) KOKEE–TSUKUB32–WETTZELL. See Figure 1 for a description of the plot design. The evolution of its structure effect over 10 yr is clearly visible.
Other Images in This Article

Show More
Copyright and Terms & Conditions
© 2019. The American Astronomical Society.
Copyright ©
2025 Astronomy Image Explorer. All Rights Reserved.