Image Details
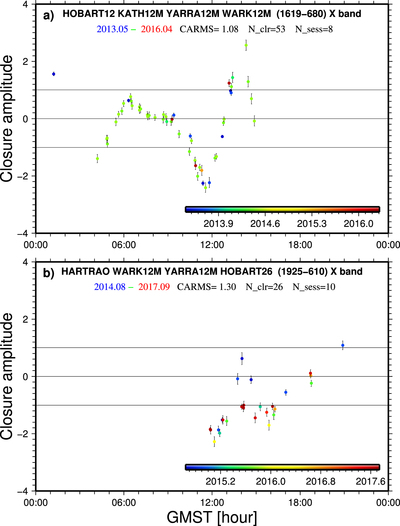
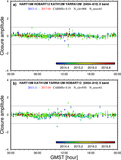
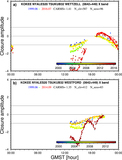
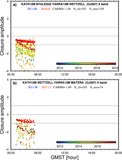
Caption: Figure 13.
Plots of closure amplitudes at the X band as a function of GMST for (a) source 1510−089 for the quadrangle HOBART12–KATH12M–YARRA12M–WARK12M and (b) source 1925−610 for the quadrangle HARTRAO–WARK12M–YARRA12M–HOBART26. See Figure 5 for a description of the plot design. Reliable structure-effect patterns are detected as shown in the two plots, even with a few tens of closure measurements. Both of these two sources have only several hundreds of closure measurements in total.
Other Images in This Article

Show More
Copyright and Terms & Conditions
© 2019. The American Astronomical Society.
Copyright ©
2025 Astronomy Image Explorer. All Rights Reserved.