Image Details
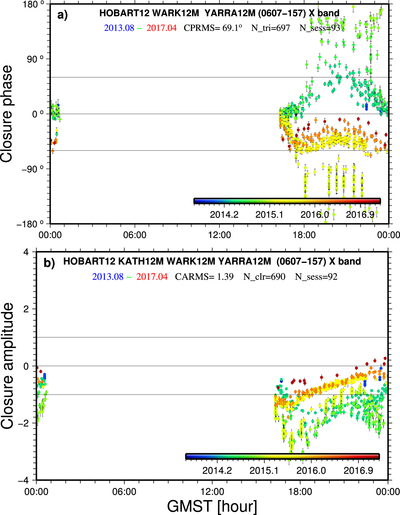
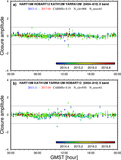
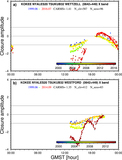
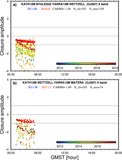
Caption: Figure 12.
Plots of structure effects of 0607−157 as a function of GMST on (a) closure phases of the triangle HOBART12–WARK12M–YARRA12M and (b) closure amplitudes of the quadrangle HOBART12–KATH12M–WARK12M–YARRA12M. For plot a, see Figure 1 for a description of the plot design, and for plot b, see Figure 5. A very extended and variable structure is detected, as shown in the two plots. It was one of the ICRF2 special handling sources but was selected as one of the defining sources for ICRF3.
Other Images in This Article

Show More
Copyright and Terms & Conditions
© 2019. The American Astronomical Society.
Copyright ©
2025 Astronomy Image Explorer. All Rights Reserved.