Image Details
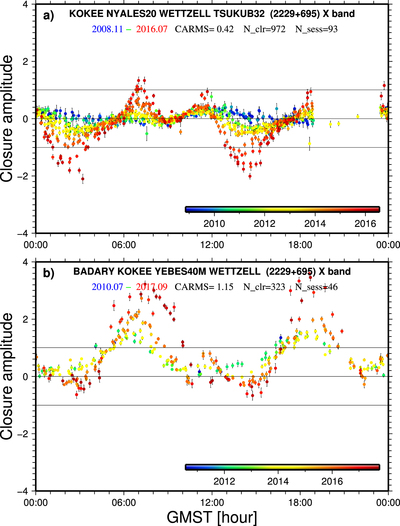
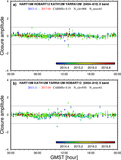
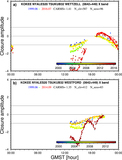
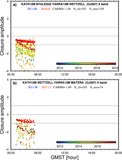
Caption: Figure 11.
Plots of closure amplitudes at the X band for source 2229+695 as a function of GMST for two quadrangles, (a) KOKEE–NYALES20–WETTZELL–TSUKUB32 and (b) BADARY–KOKEE–YEBES40M–WETTZELL. See Figure 5 for a description of the plot design. The magnitudes of the patterns in both plots increased, and the changes of the patterns with respect to GMST became more and more rapid.
Other Images in This Article

Show More
Copyright and Terms & Conditions
© 2019. The American Astronomical Society.
Copyright ©
2025 Astronomy Image Explorer. All Rights Reserved.