Image Details
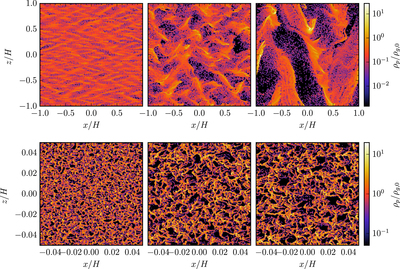
Caption: Figure 13.
Nonlinear evolution of the streaming instability computed by our algorithm. The top and the bottom rows show the models BA and AB, respectively, taken from Johansen & Youdin (2007). The models are axisymmetric and in the xz-plane, where the radial axis x and the vertical axis z are measured in terms of the gas scale height H. The color images depict the density field of the particles ﹩{\rho }_{p}﹩ in terms of the initial uniform gas density ﹩{\rho }_{g,0}﹩. The top panels show from left to right the snapshots at ﹩t=4P,14P﹩, and ﹩50P﹩, respectively, while the bottom panels show the snapshots at ﹩t=0.4P,1.4P﹩, and ﹩5P﹩, respectively, where P is the local orbital period.
Other Images in This Article
Show More
Copyright and Terms & Conditions
© 2016. The American Astronomical Society. All rights reserved.