Image Details
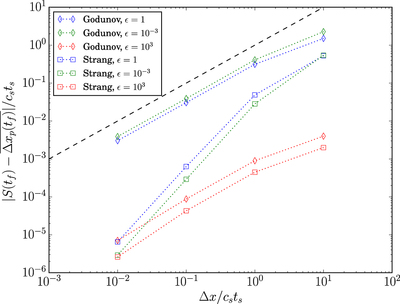
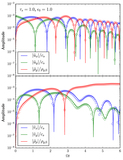
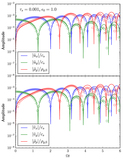
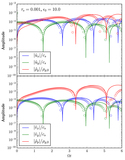
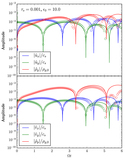
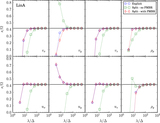
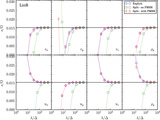
Caption: Figure 4.
Absolute error in the mean displacement of the particles as a function of cell size ﹩{\rm{\Delta }}x﹩ for the uniform streaming test. The displacements are measured at a fixed final time of ﹩{t}_{f}=2{t}_{s}﹩ and are normalized by ﹩{c}_{s}{t}_{s}﹩. The diamond and the square symbols are the results using the Godunov and the Strang splitting methods, respectively. The blue, green, and red colors denote a solid-to-gas density ratio of ﹩\epsilon =1,\epsilon ={10}^{-3}﹩, and ﹩\epsilon ={10}^{3}﹩, respectively. The dashed line indicates the cell size for a relative comparison of the errors. Note that it takes exactly one time step to reach ﹩t={t}_{f}﹩ for ﹩{\rm{\Delta }}x=10{c}_{s}{t}_{s}﹩. Note also that the accuracy of the gas and the particle velocities we obtain in this test problem is close to machine precision irrespective of the resolution, as discussed in Section 3.2.
Other Images in This Article
Show More
Copyright and Terms & Conditions
© 2016. The American Astronomical Society. All rights reserved.