Image Details
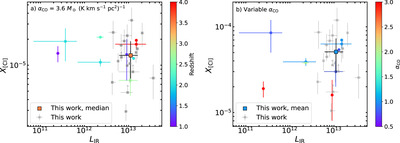
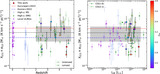
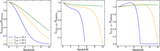
Caption: Figure 7.
Left: values of X[C I] reported in the literature as a function of the average LIR of the corresponding sample. We show the average of our sample and plot the individual points for each galaxy in gray. We show sources from A. L. R. Danielson et al. (2011), F. Walter et al. (2011), S. Alaghband-Zadeh et al. (2013), M. S. Bothwell et al. (2017), F. Valentino et al. (2018), H. Dannerbauer et al. (2019), L. A. Boogaard et al. (2020), N. P. H. Nesvadba et al. (2019), G. Gururajan et al. (2023), color coded by the average redshift of the sample. The values have been corrected for the same αCO = 3.6 (L. Dunne et al. 2022). Right: same as the panel on the left, but the points are color coded by the value of αCO used to derive each carbon abundance. The introduction of a bimodal αCO naturally leads to an equal bimodality in X[C I].
Other Images in This Article
Copyright and Terms & Conditions
© 2025. The Author(s). Published by the American Astronomical Society.