Image Details
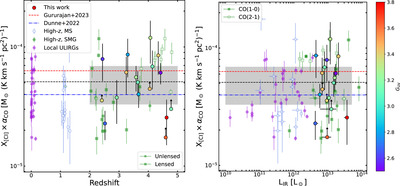
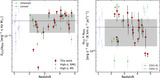
Caption: Figure 4.
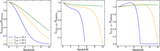
X[C I] × αCO factor as a function of redshift (left) and LIR (right) for our sample. Our sample is shown in circles, color coded by their FUV radiation field. The literature compilation is as indicated in Figure 2. The mean value for the sample in this work is shown as a black dashed line, and the gray-shaded region represents the 1σ standard deviation around the sample mean, (4.5 ± 2.0) × 10−5 (K km s−1 pc2)−1. The dashed lines mark the mean values from G. Gururajan et al. (2023) and L. Dunne et al. (2022). We fit the full sample to look for trends with either parameter, but do not find any dependence of X[C I] × αCO on either redshift or LIR. The lack of correlation with GUV suggests that X[C I] × αCO is also insensitive to local conditions of the ISM in our sample.
Other Images in This Article
Copyright and Terms & Conditions
© 2025. The Author(s). Published by the American Astronomical Society.