Image Details
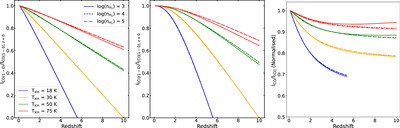
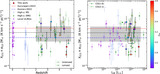
Caption: Figure 6.
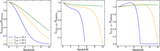
Recovered ICO(1–0) (left), I[CI](1−0) (middle), and their ratio (right) as a function of redshift. For each panel, we plot the measured intensity at each redshift divided by the intrinsic intensity measured at z = 0, where TCMB = 2.73 K. We show three examples of H2 density, log(n) = 3, 4, and 5, as well as a range of gas kinetic temperatures, for a column density of NCO,C/dv = 1018 cm−2 km−1 s.
Other Images in This Article
Copyright and Terms & Conditions
© 2025. The Author(s). Published by the American Astronomical Society.
Copyright ©
2025 Astronomy Image Explorer. All Rights Reserved.