Image Details
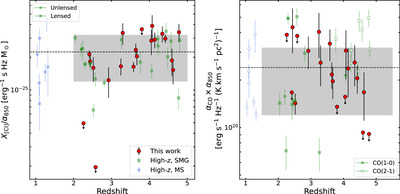
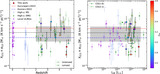
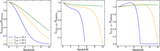
Caption: Figure 5.
X[C I]/α850 (left) and αCO × α850 (right) factors as a function of redshift for our sample. The mean value for the sample in this work is shown as a black dashed line, and the gray-shaded region represents the 1σ standard deviation around the sample mean. For comparison, we show the z ∼ 1 MS galaxies from ASPECS (L. A. Boogaard et al. 2020) and high-redshift SMGs (F. Walter et al. 2011; S. Alaghband-Zadeh et al. 2013; M. S. Bothwell et al. 2017; R. Cañameras et al. 2018; K. C. Harrington et al. 2018; N. P. H. Nesvadba et al. 2019). We do not find evidence for any trends with redshift or LIR (not shown) for either pair.
Other Images in This Article
Copyright and Terms & Conditions
© 2025. The Author(s). Published by the American Astronomical Society.