Image Details
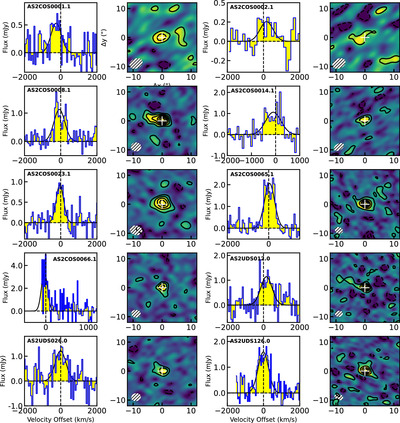
Caption: Figure 1.
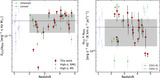
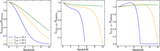
[C I](1–0) line emission for the detections in our sample of SMGs. The spectra (blue line and yellow fill, left panels) are extracted within a 2﹩\mathop{.}\limits^{\unicode{x02033}}﹩5 radius aperture to maximize the SNR. The spectra were fit with a single-Gaussian model allowing for a varying line width, shown by the black curve. The zeroth-moment maps (right panels) were collapsed over a velocity range equal to the FWHM of the respective mid–Jup CO emission line and show a 20″ × 20″ field of view. The systemic velocity is based on the redshift derived from the mid–Jup CO lines. The white cross indicates the peak of the mid–Jup CO line emission. Contours start at 2σ and increase in steps of 2σ, except for AS2COS0065.1 and AS2UDS126.0, where they do so in steps of 4σ. The white ellipse shows the FWHM of the beam for each source.
Other Images in This Article
Copyright and Terms & Conditions
© 2025. The Author(s). Published by the American Astronomical Society.