Image Details
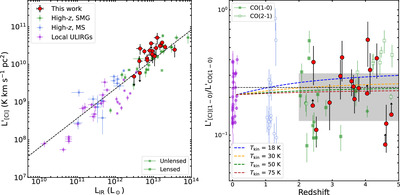
Caption: Figure 2.
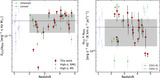
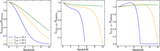
Left:[C I](1–0) line luminosities compared to LIR for our sample. As comparison, we have added the local ULIRGs from D. Liu et al. (2019), J. Kamenetzky et al. (2016) and I. Montoya Arroyave et al. (2023), the z ∼ 1 main-sequence galaxies from F. Valentino et al. (2018), G. Popping et al. (2017), S. Jin et al. (2019) and L. A. Boogaard et al. (2020), and the SMGs from F. Walter et al. (2011), S. Alaghband-Zadeh et al. (2013), M. S. Bothwell et al. (2017), R. Cañameras et al. (2018), N. P. H. Nesvadba et al. (2019), K. C. Harrington et al. (2018), H. Dannerbauer et al. (2019). We exclude galaxies classified as AGN according to F. Valentino et al. (2020). Literature luminosities are corrected for lensing magnification where necessary. The dashed line shows the best-fit relation from F. Valentino et al. (2018). Right: ﹩{L}_{[{\rm{CI}}](1-0)}^{{\prime} }﹩/﹩{L}_{\,\rm{CO(1-0)}\,}^{{\prime} }﹩ ratio as a function of redshift. The dashed black line shows the median value for our sample, log(﹩{L}_{[{\rm{CI}}](1-0)}^{{\prime} }﹩/﹩{L}_{\,\rm{CO(1-0)}\,}^{{\prime} }﹩) = −0.72, and the shaded region marks the absolute deviation around the median (0.14 dex). The dashed colored lines show the expected change in the ratio with redshift due to the warmer CMB for ﹩{n}_{{{\rm{H}}}_{2}}=1{0}^{2}﹩ cm−3 and a range of gas kinetic temperatures (see Section 3.4).
Other Images in This Article
Copyright and Terms & Conditions
© 2025. The Author(s). Published by the American Astronomical Society.