Image Details
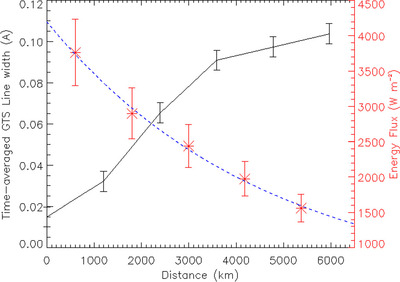
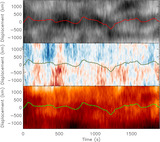
Caption: Figure 13.
A comparison of time-averaged GTS line width at each distance, shown in black, with the energy flux carried by the kink wave calculated using Equation (9), shown in red. An exponential decay fit to the energy flux is shown by the blue dashed line.
Other Images in This Article
Show More
Copyright and Terms & Conditions
© 2024. The Author(s). Published by the American Astronomical Society.
Copyright ©
2025 Astronomy Image Explorer. All Rights Reserved.