Image Details
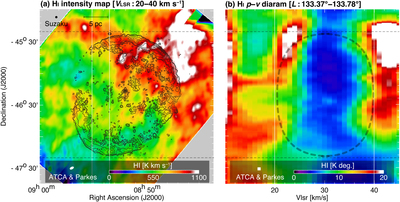
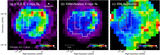
Caption: Figure 13.
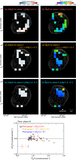
(a) Integrated intensity map of H I for RX J0852. The integration range is from 20–40 km s−1. The superposed contours represent the X-rays, and the contour levels denote 2.0, 2.5, 4.0, 6.5, 10.0, 14.5, and 20.0 × 10⁻⁴ counts s−1 pixel−1. (b) P–V diagrams of H I. The integration range is 133.°37–133.°78 in the R.A. for the P–V diagram.
Other Images in This Article

Show More
Copyright and Terms & Conditions
© 2024. The Author(s). Published by the American Astronomical Society.
Copyright ©
2025 Astronomy Image Explorer. All Rights Reserved.