Image Details
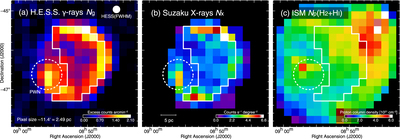
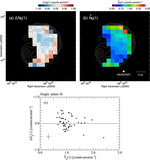
Caption: Figure 2.
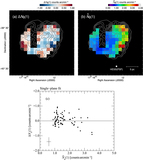
Spatial distribution of (a) N g, (b) N x, and (c) N p for RX J0852. The three data sets are pixelated on an ﹩11\buildrel{\,\prime}\over{.} 4﹩ grid to match the H.E.S.S. resolution. The white polygon in each panel indicates the region of interest for the present analysis, and the dashed circle outlines the PWN unrelated to the SNR.
Other Images in This Article

Show More
Copyright and Terms & Conditions
© 2024. The Author(s). Published by the American Astronomical Society.
Copyright ©
2025 Astronomy Image Explorer. All Rights Reserved.