Image Details
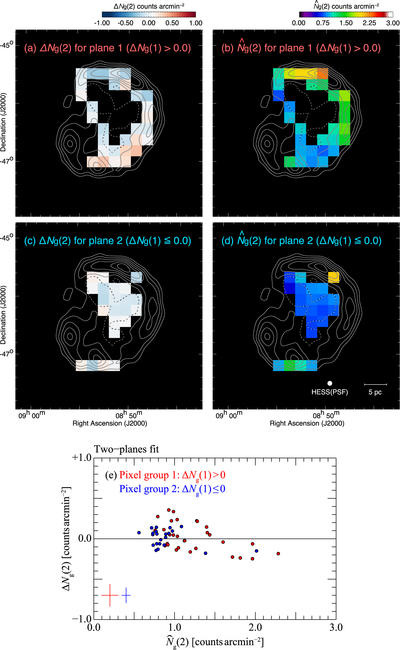
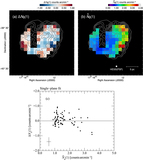
Caption: Figure 7.
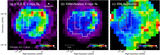
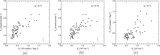
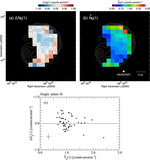
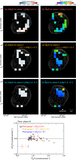
Results of the two-plane fit for RX J0852. (a)–(d) Maps of ΔN g(2) (left panels) and ﹩{\widehat{N}}_{{\rm{g}}}(2)﹩ (right panels) for the pixel groups 1 (ΔN g(1) > 0, top panels) and 2 (ΔN g(1) ≤ 0, middle panels). The superposed contours in each panel are identical to those in Figure 1. (e) A plot of ΔN g(2) with respect to ﹩{\widehat{N}}_{{\rm{g}}}(2)﹩. The horizontal and vertical error bars shown in the left bottom corner indicate the median values of ﹩\sigma ({\widehat{N}}_{{\rm{g}}}(2))﹩ and σ(ΔN g(2)), respectively. The red circles and error bars denote pixel group 1 and the blue ones pixel group 2.
Other Images in This Article

Show More
Copyright and Terms & Conditions
© 2024. The Author(s). Published by the American Astronomical Society.