Image Details
Caption: Figure 1.
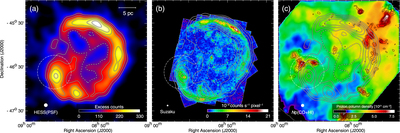
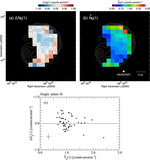
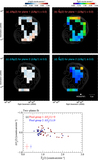
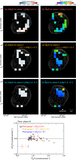
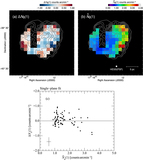
Maps of (a) TeV gamma-ray excess counts (E > 100 GeV) (H.E.S.S. Collaboration 2018c), (b) X-ray counts (E = 2.0–5.7 keV) (Paper II), and (c) ISM proton column density (this work) toward RX J0852. The superposed white contours in panels (a)–(c) indicate excess counts of TeV gamma rays (the lowest level and intervals are 120 and 40 counts, respectively). The black contours in panel (c) indicate the 12CO(J = 1–0) intensity integrated into a velocity range of 20–40 km s−1 (the contour levels are 2.5, 5.0, 7.5, 12.5, and 17.5 K km s−1). The dashed–dotted circle outlines the PWN unrelated to the SNR (see the H.E.S.S. Collaboration 2018c).
Other Images in This Article

Show More
Copyright and Terms & Conditions
© 2024. The Author(s). Published by the American Astronomical Society.