Image Details
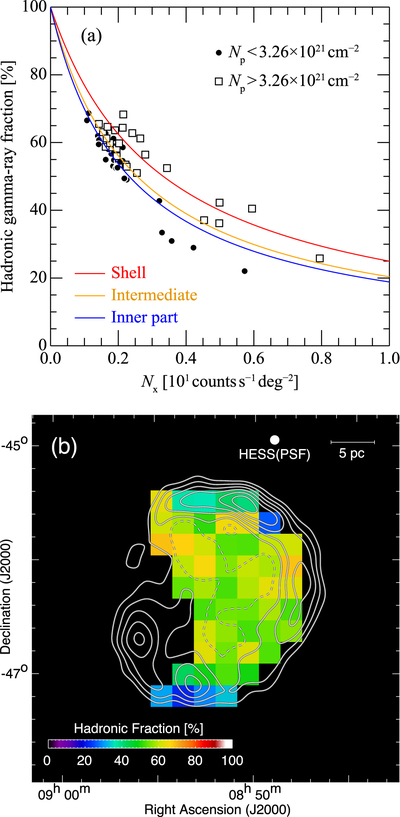
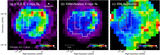
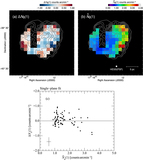
Caption: Figure 9.
(a) Scatter plot between hadronic gamma-ray fraction and N x for RX J0852. The filled circles and open squares represent the data points where N p < 3.26 × 10²¹ and <3.26 × 1021 cm−2, respectively. The overlaid solid lines show the relationships derived by the equation aN p/(aN p + bN x) for N p = 3.26 × 1021 cm−2. The red, orange, and blue lines show the shell, intermediate, and inner parts of the SNR, respectively (the a and b values for each part are in Table 3). (b) Distributions of hadronic gamma-ray fraction overlaid with gamma-ray contours (identical to those in Figure 1).
Other Images in This Article
Show More
Copyright and Terms & Conditions
© 2024. The Author(s). Published by the American Astronomical Society.