Image Details
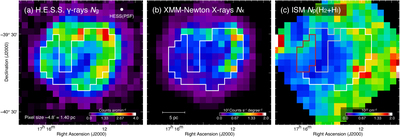
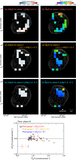
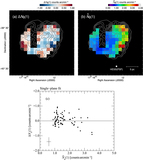
Caption: Figure 4.
Spatial distribution of (a) N g, (b) N x, and (c) N p for RX J1713 (identical to the H.E.S.S.18 (E > 2 TeV) ﹩4\buildrel{\,\prime}\over{.} 8﹩ resolution data set in Paper III). The white polygon in each panel indicates the region of interest for the present analysis. The red polygon in panel (c) outlines the region where the H I absorption is corrected (see Section 2.3 of Paper III).
Other Images in This Article

Show More
Copyright and Terms & Conditions
© 2024. The Author(s). Published by the American Astronomical Society.
Copyright ©
2025 Astronomy Image Explorer. All Rights Reserved.