Image Details

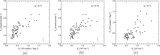
Caption: Figure 3.
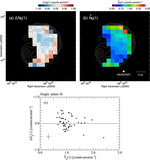
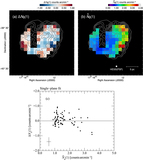
Scatter plots of (a) N g-N x, (b) N g-N p, and (c) N p-N x for RX J0852. The correlation coefficient is noted in the upper right corner of each panel, and the horizontal/vertical error bars in the bottom-right corner represent the median values of the uncertainties.
Other Images in This Article

Show More
Copyright and Terms & Conditions
© 2024. The Author(s). Published by the American Astronomical Society.
Copyright ©
2025 Astronomy Image Explorer. All Rights Reserved.