Image Details
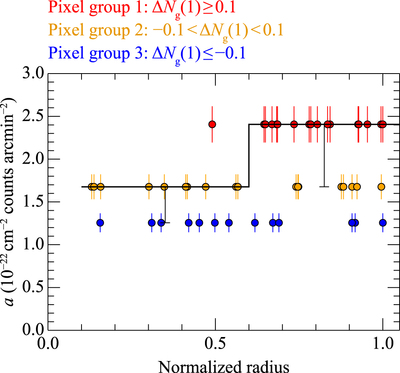
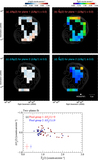
Caption: Figure 12.
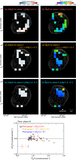
Fitted coefficient a vs. the SNR radius of RX J0852. The error bar associated with each data point represents the standard error. The red circles and error bars represent pixel group 1, and the orange and blue represent pixel groups 2 and 3, respectively. The median values of a are shown for two bins of the normalized radius, with the vertical error bars showing the interquartile range (in each bin, the upper quartile is the same as the median).
Other Images in This Article

Show More
Copyright and Terms & Conditions
© 2024. The Author(s). Published by the American Astronomical Society.
Copyright ©
2025 Astronomy Image Explorer. All Rights Reserved.