Image Details
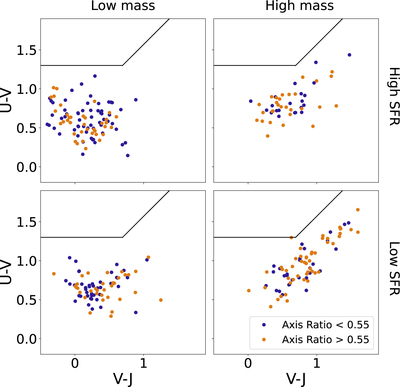
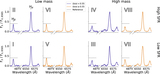
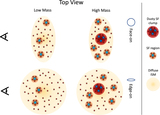
Caption: Figure 8.
The UVJ diagram for each of the eight groups, organized by stellar mass (left: low mass, and right: high mass), SFR (bottom: low SFR, and top: high SFR), and axis ratio (blue: edge-on, and orange: face-on). All points fall in the region of star-forming galaxies in the diagram. Galaxies with more dust tend to be located toward the upper right corner of the diagram (e.g., Patel et al. 2012). Within each group, the distribution of points is similar, indicating that there is no correlation between dust and axis ratio. By comparing the groups, we see that the high-mass galaxies appear to have higher U-V and V-J, which is consistent with the hypothesis that high-mass galaxies are more dusty.
Other Images in This Article
Show More
Copyright and Terms & Conditions
© 2023. The Author(s). Published by the American Astronomical Society.