Image Details
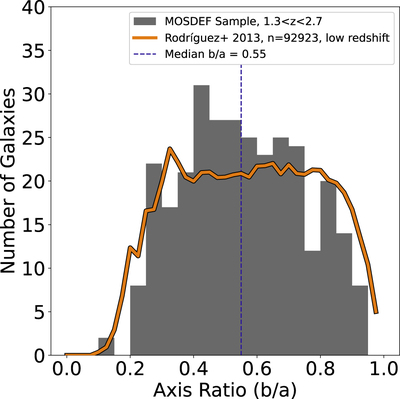
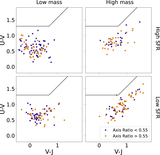
Caption: Figure 3.
Histogram of the axis ratios for all galaxies in our sample, with a low-redshift star-forming disky comparison sample from Rodríguez & Padilla (2013) in orange. The dashed blue line shows the division between edge-on and face-on galaxies by the median axis ratio ﹩\left(b/a=0.55\right)﹩. The observed distribution is consistent with the expected relatively flat distribution for disk galaxies, and it is inconsistent with the expected rising distribution for elliptical galaxies.
Other Images in This Article
Show More
Copyright and Terms & Conditions
© 2023. The Author(s). Published by the American Astronomical Society.
Copyright ©
2025 Astronomy Image Explorer. All Rights Reserved.