Image Details
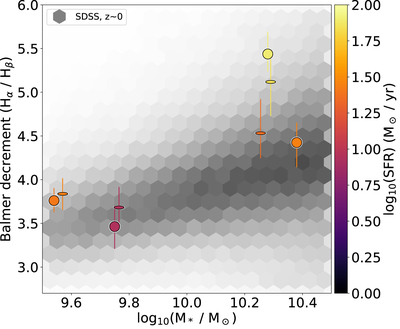
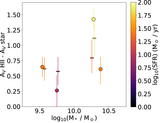
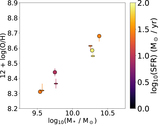
Caption: Figure 5.
Balmer decrement vs. the median stellar mass in each of the eight groups, color-coded by SFR, with the Balmer decrement of low-redshift SDSS galaxies shown in the gray background hexagons. Flat colored symbols show edge-on galaxies (b/a < 0.55), while colored circles show face-on galaxies (b/a ≥ 0.55). Edge-on galaxies have the same Balmer decrement as face-on galaxies at fixed mass and SFR in this sample. Consistent with previous findings, a clear trend with mass is visible, where higher-mass galaxies have higher Balmer decrements (e.g., Garn & Best 2010; Shapley et al. 2022). No strong residual trends appear with the axis ratio or SFR for low-mass galaxies. At high mass, galaxies with higher SFR have slightly higher Balmer decrements.
Other Images in This Article
Show More
Copyright and Terms & Conditions
© 2023. The Author(s). Published by the American Astronomical Society.