Image Details
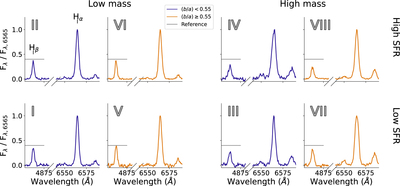
Caption: Figure 4.
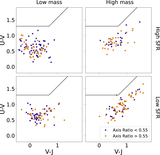
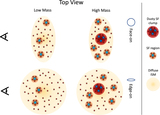
Stacked spectra for the eight groups illustrated in Figure 1. We organize the spectra by stellar mass (left: low mass, right: high mass), SFR (bottom: low SFR, top: high SFR), and axis ratio (blue: edge-on, orange: face-on). The continuum has been subtracted for all stacked spectra. The spectra are normalized so they have the same Hα peak flux for visual comparison. It is visible that the lower-mass galaxies (left) have higher normalized Hβ fluxes than the higher-mass galaxies (right), which results in a smaller Balmer decrement for the lower-mass galaxies. We do not observe a clear change in the Balmer decrement with a changing axis ratio for any of the groups.
Other Images in This Article
Show More
Copyright and Terms & Conditions
© 2023. The Author(s). Published by the American Astronomical Society.