Image Details
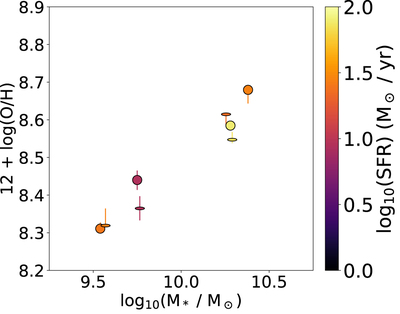
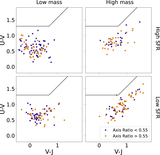
Caption: Figure 10.
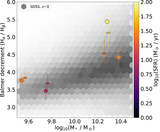
Gas-phase metallicity computed from O3N2 plotted against stellar mass for each of the eight groups. The points are colored by SFR. The measured metallicities show a clear mass–metallicity relation, as expected. At similar stellar mass, a higher SFR leads to a lower metallicity, also as expected.
Other Images in This Article
Show More
Copyright and Terms & Conditions
© 2023. The Author(s). Published by the American Astronomical Society.
Copyright ©
2025 Astronomy Image Explorer. All Rights Reserved.