Image Details
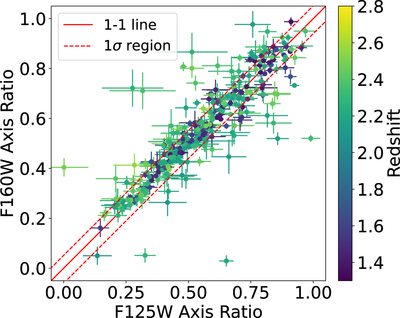
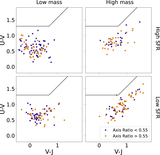
Caption: Figure 2.
Comparison between the measured F125W and F160W axis ratios for the galaxies in our sample, color-coded by redshift. A one-to-one line is drawn in solid red, and the dashed lines show the 16th and 84th percentiles of the distribution of deviations from the one-to-one line. The measurements are well correlated, so there is very little ambiguity between edge-on and face-on galaxies when they are divided into two axis-ratio groups. We choose to use F160W axis ratios for galaxies in the higher-redshift group (z > 2.09) and the F125W axis ratios for galaxies in the lower-redshift group (z < 1.7) so that all galaxies are classified at similar rest-frame wavelengths.
Other Images in This Article
Show More
Copyright and Terms & Conditions
© 2023. The Author(s). Published by the American Astronomical Society.