Image Details
Caption: Figure 1.
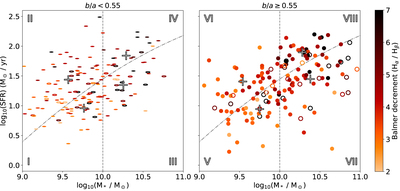
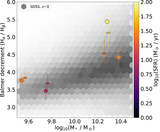
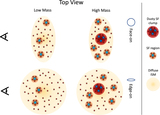
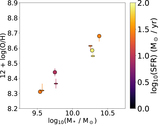
SFR vs. stellar mass of star-forming galaxies in our subsample from the MOSDEF survey at 1.37 ≤ z ≤ 2.61, split into edge-on galaxies (b/a < 0.55) (left, ellipses) and face-on galaxies (b/a ≥ 0.55) (right, circles). These symbols are used throughout this work to denote edge-on (ellipses) and face-on (circles). The dashed lines show the divisions into groups by mass and the Whitaker et al. (2014) fit to the star-forming main sequence scaled to our sample. Symbols are color-coded by their initial measurement of Balmer decrement, and galaxies with lower limits on their Balmer decrement are displayed as open points. The median stellar mass and SFR for each of the eight groups is denoted with a gray cross. From this figure, it is already apparent that higher-mass galaxies have higher Balmer decrements.
Other Images in This Article
Show More
Copyright and Terms & Conditions
© 2023. The Author(s). Published by the American Astronomical Society.