Image Details
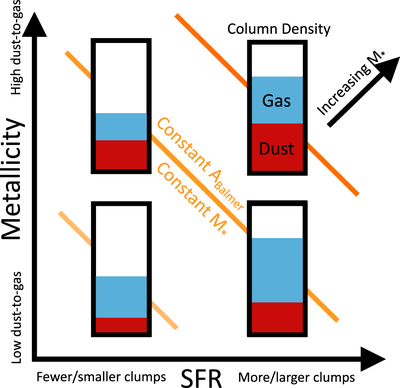
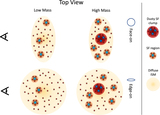
Caption: Figure 12.
Diagram depicting how the relation between the SFR and the metallicity affects the Balmer attenuation. The bars represent the column density of gas (blue) and dust (red) encountered by escaping light for the galaxies that fall in the corresponding parts of the SFR-metallicity plane. The lines of roughly constant ABalmer (from Equation (8)) and constant mass (from the FMR) are shown in the background in orange. Galaxies at a higher SFR (right) have more star-forming clumps, so the light sees a longer path length of gas and dust on average. Galaxies with higher metallicities (top) have higher dust-to-gas ratios, so a larger fraction of their gas column density is filled with obscuring dust. This representation shows that galaxies with the same dust column density (i.e., top left and bottom right) and thus the same Balmer attenuation can have very different metallicities and SFRs.
Other Images in This Article
Show More
Copyright and Terms & Conditions
© 2023. The Author(s). Published by the American Astronomical Society.