Image Details
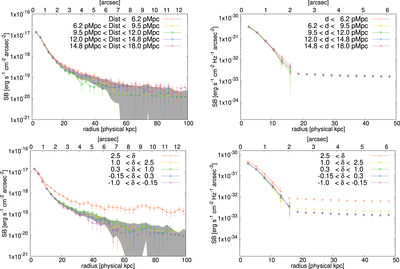
Caption: Figure 20.
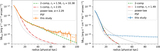
Same as Figure 19, but here the LAEs are grouped by their projected distances from the HLQSO (top) and local environment (bottom) in the manner specified in Table 1. The gray shaded regions in the top (bottom) panel shows fifth and 95th percentile of the Lyα SB distribution of stacked images created with randomly selected 700 (1000) LAEs.
Other Images in This Article

Show More
Copyright and Terms & Conditions
© 2023. The Author(s). Published by the American Astronomical Society.
Copyright ©
2025 Astronomy Image Explorer. All Rights Reserved.