Image Details
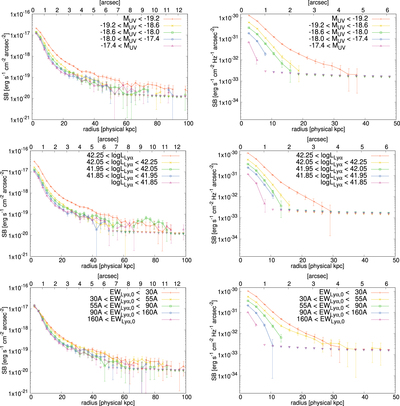
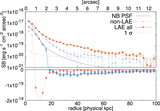
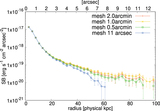
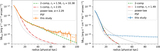
Caption: Figure 19.
Lyα SB profiles (left) and UV continuum SB profiles (right) derived by stacking analysis. From top to bottom, the LAE sample is grouped by their UV magnitude, Lyα luminosity, and Lyα equivalent width in the manner specified in Table 1. The error bars are slightly shifted horizontally for display purpose. Downward triangles show 1σ error levels after residual sky subtraction.
Other Images in This Article

Show More
Copyright and Terms & Conditions
© 2023. The Author(s). Published by the American Astronomical Society.
Copyright ©
2025 Astronomy Image Explorer. All Rights Reserved.