Image Details
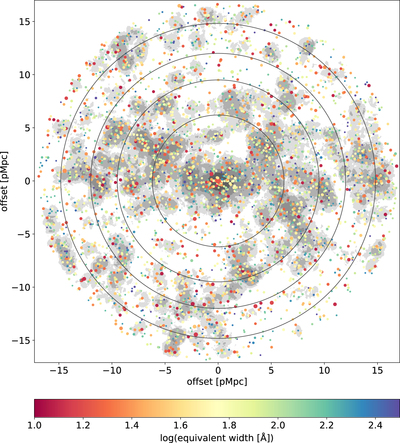
Caption: Figure 1.
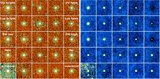
Sky distribution of our LAEs (colored dots). The HLQSO is located at the origin (0,0). North is up, and east to the left. The colors indicate their rest-frame Lyα equivalent width, and the sizes indicate their UV absolute magnitude (the larger, the brighter). Gray contours indicate their overdensity δ, with each level showing a different group defined in Table 1. Concentric black circles indicate radii with which the distance subsamples are defined.
Other Images in This Article
Show More
Copyright and Terms & Conditions
© 2023. The Author(s). Published by the American Astronomical Society.
Copyright ©
2025 Astronomy Image Explorer. All Rights Reserved.