Image Details
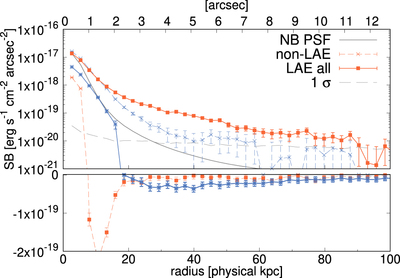
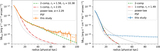
Caption: Figure 7.
Radial SB profile of LAEs (solid) and non-LAEs (dashed) in the Lyα (orange) and continuum (blue curve) images are shown. Gray dashed curve shows 1σ noise level. On the bottom side, SB profiles below ﹩1\times {10}^{-21}\,\mathrm{erg}\,{{\rm{s}}}^{-1}\,{\mathrm{cm}}^{-2}\,{\mathrm{arcsec}}^{-2}﹩ level are shown in linear scale. The normalized PSF of the NB image is shown with the gray solid curve.
Other Images in This Article

Show More
Copyright and Terms & Conditions
© 2023. The Author(s). Published by the American Astronomical Society.
Copyright ©
2025 Astronomy Image Explorer. All Rights Reserved.