Image Details
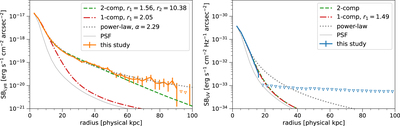
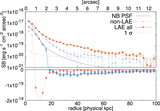
Caption: Figure 9.
Radial Lyα (left) and UV (right) SB profiles of all LAEs are shown with solid orange and blue curves with error bars. Dashed, dotted–dashed, and dotted curves respectively show the result of fitting with two- and one-component exponential functions and a power-law function. The normalized PSF of the NB image is shown with the thin gray curve. Downward triangles show 1σ error levels after residual sky subtraction.
Other Images in This Article

Show More
Copyright and Terms & Conditions
© 2023. The Author(s). Published by the American Astronomical Society.
Copyright ©
2025 Astronomy Image Explorer. All Rights Reserved.