Image Details
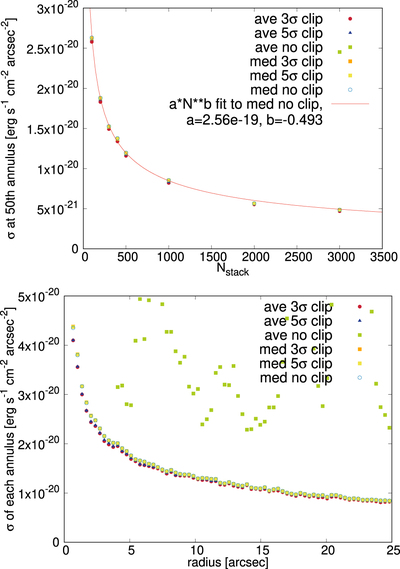
Caption: Figure 3.
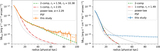
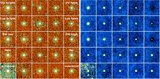
Top: estimating the sky noise level of the Lyα image. The x-axis shows how many sky cutouts were stacked, and the y-axis shows the estimated noise level evaluated in 50th annulus from the center (thus r = 100 pixel or 17″) containing 1270 pixels. Different points indicate the different stacking methods (average VS. median, with 3σ or 5σ clipping VS. no σ clipping), which are well converged except for the case with average without σ clipping. The red curve is a fitting function with a form a −N b to the blue circles, which is consistent with inverse square root proportionality (b = −0.493 ± 0.0074). Symbols for “ave no clip” are mostly out of the upper boundary. Bottom: the estimated noise level of each annulus for the N stack = 700 case. Their behavior with respect to the stacking methods is the same as the above figure.
Other Images in This Article

Show More
Copyright and Terms & Conditions
© 2023. The Author(s). Published by the American Astronomical Society.