Image Details
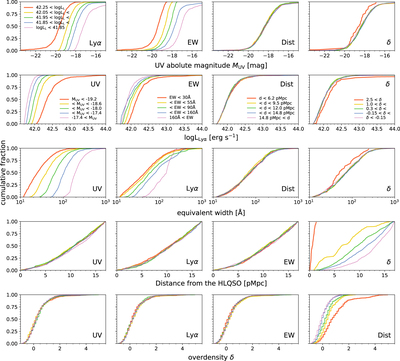
Caption: Figure 2.
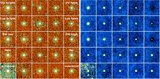
From top to bottom, cumulative distributions of UV magnitude, Lyα luminosity, rest-frame Lyα EW, distance from the HLQSO, and overdensity of all subsamples described in Table 1 and the top left panel and panels in the second row. In each panel, the quantity used to divide the sample is labeled. Thicker curves present [UV brighter, Lyα brighter, lower EW, farther from the HLQSO, denser] subsamples. Note that, in the second row, last column, the 2.5 < δ subsample contains 4 sources with L Lyα > 1044 erg s−1 (including the HLQSO), and thus the red curve does not reach to unity.
Other Images in This Article

Show More
Copyright and Terms & Conditions
© 2023. The Author(s). Published by the American Astronomical Society.