Image Details
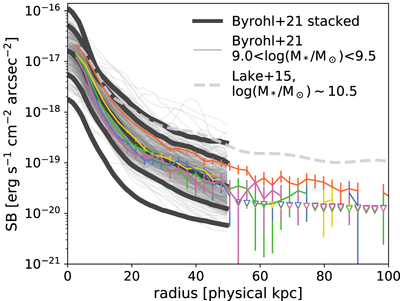
Caption: Figure 18.
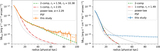
Stacked Lyα SB profiles of galaxies at z = 3 for five different intervals of stellar mass from the Byrohl et al. (2021) simulation (thick gray) along with the averaged SB profile predicted in Lake et al. (2015; dashed) and our results (colored with error bars, UV subsamples from the top left panel of Figure 19). The thick gray curves represent, from bottom to top, profiles of galaxies with ﹩8.0\lt \mathrm{log}({M}_{* }/{M}_{\odot })\lt 8.5﹩, ﹩8.5\lt \mathrm{log}({M}_{* }/{M}_{\odot })\lt 9.0﹩, ﹩9.0\lt \mathrm{log}({M}_{* }/{M}_{\odot })\lt 9.5﹩, ﹩9.5\lt \mathrm{log}({M}_{* }/{M}_{\odot })\lt 10﹩, and ﹩10\lt \mathrm{log}({M}_{* }/{M}_{\odot })\lt 10.5﹩. To show the diversity of Lyα SB profiles, we show all profiles of galaxies with ﹩9.0\lt \mathrm{log}({M}_{* }/{M}_{\odot })\lt 9.5﹩ with thin gray curves. The B21 and L15 results are corrected for a slight redshift dimming effect by scaling (1 + z)4/(1 + 2.845)4 (z = 3.0 for B21 and 3.1 for L15).
Other Images in This Article

Show More
Copyright and Terms & Conditions
© 2023. The Author(s). Published by the American Astronomical Society.