Image Details
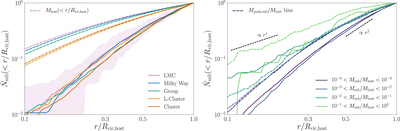
Caption: Figure 8.
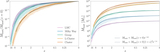
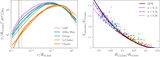
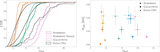
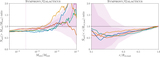
Left panel: cumulative subhalo radial distributions as a function of distance from the host halo center, in units of the host halo virial radius, for our five zoom-in simulation suites. Solid lines show mean radial distributions stacked over each suite, and the shaded band shows the 16th–84th percentiles for the LMC suite. Only subhalos above a resolution cut of M sub/M host > 2.7 × 10⁴ are used to compute the radial distribution for each zoom-in, and each radial distribution is normalized to the total number of subhalos above this cut within the host halo’s virial radius. Dashed lines show mean enclosed mass profiles, normalized by host halo virial mass, stacked over hosts in each suite. Right panel: normalized subhalo radial distributions, stacked over all suites, in bins of sub-to-host halo mass ratio binned by z = 0 (solid) and peak (dashed) subhalo virial mass. Dashed black lines indicate normalized radial distributions proportional to r and r 2 for reference.
Other Images in This Article
Show More
Copyright and Terms & Conditions
© 2023. The Author(s). Published by the American Astronomical Society.