Image Details
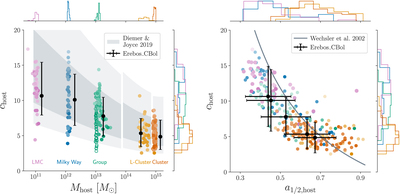
Caption: Figure 3.
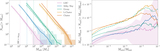
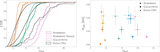
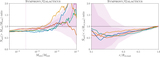
Left panel: joint and marginal distributions of z = 0 halo virial mass and NFW concentration for hosts in our zoom-in simulation suites. Each point represents a unique zoom-in simulation with particle mass of m part ≈ 3 × 10⁻⁷ M host and is shaded according to the abundance of subhalos with M sub/M host > 2.7 × 10⁻⁴; darker colors indicate hosts with higher subhalo abundance relative to the rest of the hosts in each suite. Unfilled Group points show host mass and concentration values at z = 0.5, when these halos were mass-selected in their parent simulation. The three dark (light) gray bands show the 1σ (2σ) uncertainty on the median mass–concentration relation from Diemer & Joyce (2019) for our LMC/Milky Way/Group, L-Cluster, and Cluster cosmological parameters, respectively. Black points and error bars show medians and 1σ scatter from the Erebos simulations (Diemer & Kravtsov 2014, 2015) for halos in each suite’s mass range that satisfy the corresponding isolation criteria; these measurements differ from the Diemer & Joyce (2019) relation for the LMC, Milky Way, and Group suites due to these cuts. Right panel: joint and marginal distributions of host half-mass scale factor and NFW concentration. The gray line shows the prediction for the c host(a 1/2,host) relation from Wechsler et al. (2002), for reference; this model is calibrated using σ 8 = 1.0, which contributes to the normalization offset, and is not re-fit here. Manual inspection of individual mass accretion histories (MAHs) indicates that points with large a 1/2,host for a given c host recently experienced a major merger.
Other Images in This Article
Show More
Copyright and Terms & Conditions
© 2023. The Author(s). Published by the American Astronomical Society.