Image Details
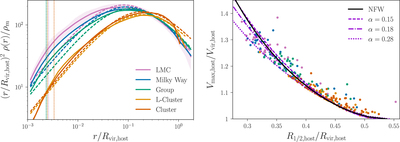
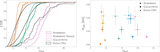
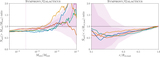
Caption: Figure 6.
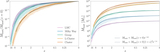
Left panel: mean density profiles of Symphony host halos normalized to the mean cosmological matter density at z = 0, as a function of distance from the host center in units of the virial radius, for each suite (solid lines). Dashed lines show the mean of the best-fit NFW profiles reported by ROCKSTAR for each suite. Shaded bands indicate 68% host-to-host scatter, which is only shown for the LMC suite for visual clarity. Dotted vertical lines show approximate convergence radii of 2.8ϵ (e.g., Ludlow et al. 2019) for each suite, below which density profile measurements may not be converged. Right panel: maximum circular velocity normalized to the virial velocity vs. half-mass–radius normalized to the virial radius for all host halos in our five zoom-in suites. Points are colored by suite following the color scheme in the left panel. The black line shows the relation for an NFW profile, and purple lines show relations for Einasto profiles with α = 0.15 (solid), α = 0.18 (dotted–dashed), and α = 0.28 (dotted).
Other Images in This Article
Show More
Copyright and Terms & Conditions
© 2023. The Author(s). Published by the American Astronomical Society.