Image Details
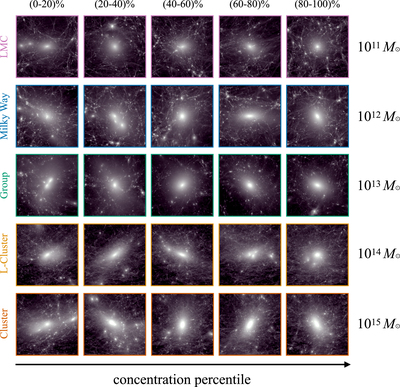
Caption: Figure 2.
Visualizations of the projected dark matter density at z = 0, centered on five host halos from each of our zoom-in suites. The host halo mass scale of each zoom-in suite increases from top to bottom. Within each suite, columns show hosts randomly selected from concentration quintiles, such that concentration increases from left to right. Each visualization spans its host’s virial radius in projection. Visualizations were created using the phase-space tessellation method described in Kaehler (2017) and Kaehler (2018).
Other Images in This Article
Show More
Copyright and Terms & Conditions
© 2023. The Author(s). Published by the American Astronomical Society.
Copyright ©
2025 Astronomy Image Explorer. All Rights Reserved.