Image Details
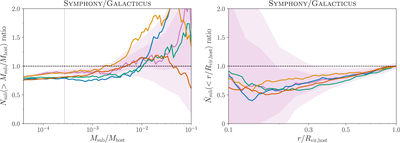
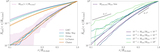
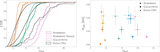
Caption: Figure 10.
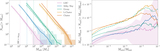
Left panel: the ratio of cumulative subhalo mass functions in each Symphony suite to corresponding GALACTICUS predictions. Solid lines show the ratio of median cumulative SHMFs stacked over all Symphony zoom-ins and GALACTICUS realizations in our LMC (pink), Milky Way (blue), Group (green), Low-Cluster (gold), and Cluster (red) mass ranges. Dark (light) shaded bands indicate the corresponding 1σ (2σ) Poisson errors on the mean, which we only show for the LMC suite for visual clarity. The vertical dotted line indicates our conservative convergence limit of M sub/M host > 2.7 × 10⁻⁴, and the horizontal dashed line indicates perfect agreement between Symphony and GALACTICUS. Right panel: same as the left panel, for the ratio between Symphony and GALACTICUS cumulative radial distributions in units of distance from the host center divided by the host halo virial radius.
Other Images in This Article
Show More
Copyright and Terms & Conditions
© 2023. The Author(s). Published by the American Astronomical Society.