Image Details
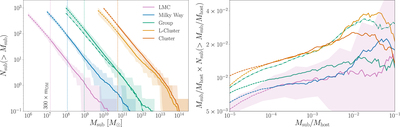
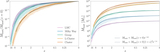
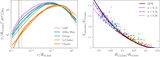
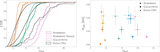
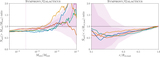
Caption: Figure 7.
Left panel: subhalo mass functions evaluated using virial mass at z = 0 for our five zoom-in simulation suites. Solid lines show mean SHMFs stacked over each suite, and shaded bands show the corresponding 16th–84th percentiles of the host-to-host scatter. The dotted–dashed line Group result shows the SHMF at z = 0.5, when the corresponding host halos were mass-selected in their parent box. Vertical dotted lines show the convergence limit for each simulation, calculated as 300 times the dark matter particle mass in the highest-resolution zoom-in region, and lines transition from solid to dashed at the median M sub/M host threshold corresponding to the convergence limit for each suite. Right panel: same as the left panel, but scaled to highlight the dependence on host mass. Subhalo masses are normalized by M host to remove most of the linear dependence of subhalo abundance on host mass, and abundances are scaled by M sub/M host to reduce the dynamic range of the y-axis. In this panel, host-to-host scatter is only shown for the LMC suite for visual clarity.
Other Images in This Article
Show More
Copyright and Terms & Conditions
© 2023. The Author(s). Published by the American Astronomical Society.