Image Details
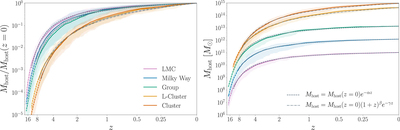
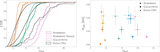
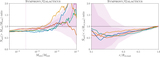
Caption: Figure 5.
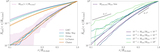
Left panel: MAHs for the host halos in our five zoom-in simulation suites normalized to the z = 0 virial mass for each host. Solid lines show mean MAHs for all hosts in each suite, and shaded bands show the corresponding 68% host-to-host scatter about the mean. Lines transition to dashed at the redshift above which >5% of the hosts in each suite are resolved with fewer than 300 particles. Jackknife resampling of the LMC, Milky Way, and Group suites indicates that the difference between normalized MAHs is marginally significant at z ≳ 2 and not significant at later times; the difference between L-Cluster and Cluster MAHs is not statistically significant (see Section 3.4 for details). Dashed (dotted–dashed) gray lines show best-fit MAHs using the Wechsler et al. (2002) exponential model and the Tasitsiomi et al. (2004) exponential plus power-law model adopted by McBride et al. (2009b); best-fit parameters are provided in the text. Right panel: same as the left panel, but not normalized to z = 0 host halo virial mass.
Other Images in This Article
Show More
Copyright and Terms & Conditions
© 2023. The Author(s). Published by the American Astronomical Society.