Image Details
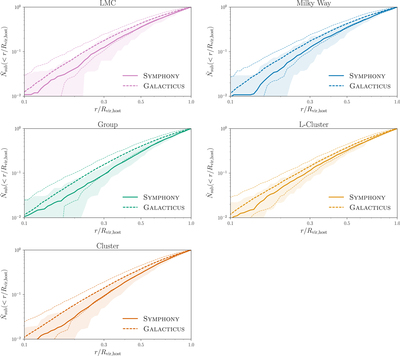
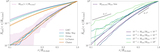
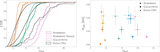
Caption: Figure 19.
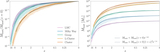
Comparison of normalized radial distributions in our five zoom-in simulation suites with GALACTICUS predictions. In each panel, the solid line shows the mean cumulative normalized radial profile, stacked over all simulations in each Symphony suite, and the shaded band shows the corresponding 2.5th–97.5th percentile range. Dashed lines show the corresponding GALACTICUS predictions and percentiles. Only subhalos above our conservative sub-to-host halo resolution threshold of M sub/M host > 2.7 × 10⁻⁴ are included.
Other Images in This Article
Show More
Copyright and Terms & Conditions
© 2023. The Author(s). Published by the American Astronomical Society.
Copyright ©
2025 Astronomy Image Explorer. All Rights Reserved.