Image Details
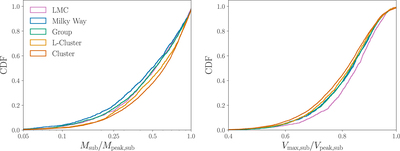
Caption: Figure 16.
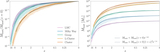
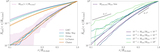
Left panel: cumulative distributions of Symphony subhalos’ z = 0 virial mass, M sub, divided by the largest virial mass achieved along each subhalo’s main branch, M peak,sub, stacked over all subhalos from each suite with M sub/M host > 2.7 × 10⁻⁴. Right panel: same as the left panel, for the ratio of z = 0 maximum circular velocity, ﹩{V}_{\max ,\mathrm{sub}}﹩, to the largest ﹩{V}_{\max ,\mathrm{sub}}﹩ achieved along each subhalo’s main branch, V peak,sub.
Other Images in This Article
Show More
Copyright and Terms & Conditions
© 2023. The Author(s). Published by the American Astronomical Society.
Copyright ©
2025 Astronomy Image Explorer. All Rights Reserved.