Image Details
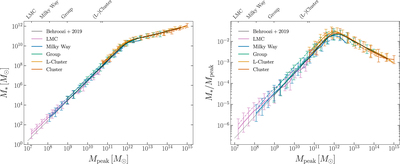
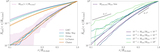
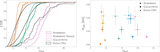
Caption: Figure 12.
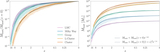
Left panel: stellar mass–halo mass (SMHM) relations predicted by applying the UNIVERSEMACHINE DR1 model to all Symphony suites. Solid lines represent the median SMHM relation stacked over all simulations in each Symphony suite using all halos and subhalos above our fiducial-resolution cut of M sub > 300m part and within 5R vir,host of each Symphony host; dashed lines only include subhalos of the target host in each simulation. Error bars denote the 68% scatter, which is dominated by intrinsic scatter in the galaxy–halo connection rather than host-to-host scatter. The top axis denotes each suite’s resolution limit in terms of z = 0 (sub)halo virial mass (i.e., M sub > 300m part); however, M peak,sub is less well converged than M sub (see Appendix B.2), so these ticks should only be interpreted as rough estimates of the resolution limits. The black curve shows the z = 0 SMHM relation from Behroozi et al. (2019) for comparison, and transitions to a dotted power-law extrapolation of the DR1 prediction at stellar masses where it is not constrained. Right panel: same as the left panel, but with stellar mass normalized to each (sub)halo’s peak virial mass.
Other Images in This Article
Show More
Copyright and Terms & Conditions
© 2023. The Author(s). Published by the American Astronomical Society.