Image Details
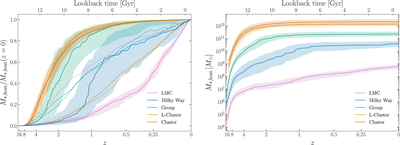
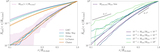
Caption: Figure 11.
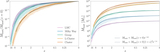
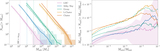
Left panel: SFHs of central galaxies that occupy Symphony hosts, stacked over all host halos in each suite. Solid lines show the median evolution of the intrinsic stellar mass (i.e., the predicted stellar mass uncorrected for observational systematics and massive stars’ death over time), normalized to each host’s predicted stellar mass at z = 0, and shaded regions denote the 68% host-to-host scatter for each suite. Dashed lines show the corresponding mean normalized dark matter MAHs (see the left panel of Figure 5). Right panel: same as the left panel, but for hosts’ un-normalized SFHs.
Other Images in This Article
Show More
Copyright and Terms & Conditions
© 2023. The Author(s). Published by the American Astronomical Society.
Copyright ©
2025 Astronomy Image Explorer. All Rights Reserved.