Image Details
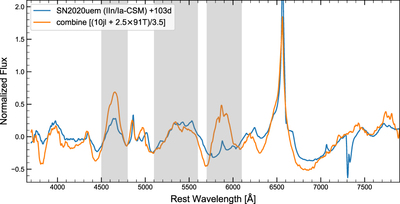
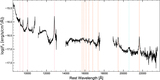
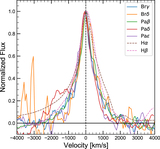
Caption: Figure 14.
Comparison of the normalized spectrum of SN 2020uem and a “combined” spectrum created by adding the spectra of SN 1991T and SN 2010jl. The combined spectrum is composed by 2.5 × 91T-flux and 1 × 10jl-flux, and additionally normalized by a factor of 3.5. Each base spectrum in the combination is already normalized by its continuum, which is the same spectrum plotted in Figure 13. The gray shaded regions are the same as those in Figure 13.
Other Images in This Article

Show More
Copyright and Terms & Conditions
© 2023. The Author(s). Published by the American Astronomical Society.
Copyright ©
2025 Astronomy Image Explorer. All Rights Reserved.