Image Details
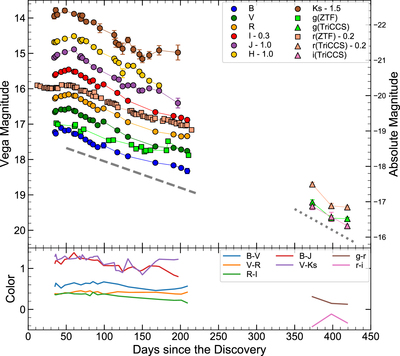
Caption: Figure 2.
Top panel: optical (BgVrRiI band) and NIR (JHKs band) light curves of SN 2020uem. The magnitudes in some bandpasses are shifted by the values shown in the legend. The left axis shows the apparent magnitude and the right axis shows the absolute magnitude, both in the Vega system. The gray dashed and dotted lines show decline rates of 0.75 mag/100 days and 1.2 mag/100 days, respectively. Bottom panel: color evolution (B − V, V − R, R − I, B − J, V − Ks, g − r, and r − i) of SN 2020uem.
Other Images in This Article

Show More
Copyright and Terms & Conditions
© 2023. The Author(s). Published by the American Astronomical Society.
Copyright ©
2025 Astronomy Image Explorer. All Rights Reserved.